

Review the top three projects in Summary
By Tristan Doehl · · Updated
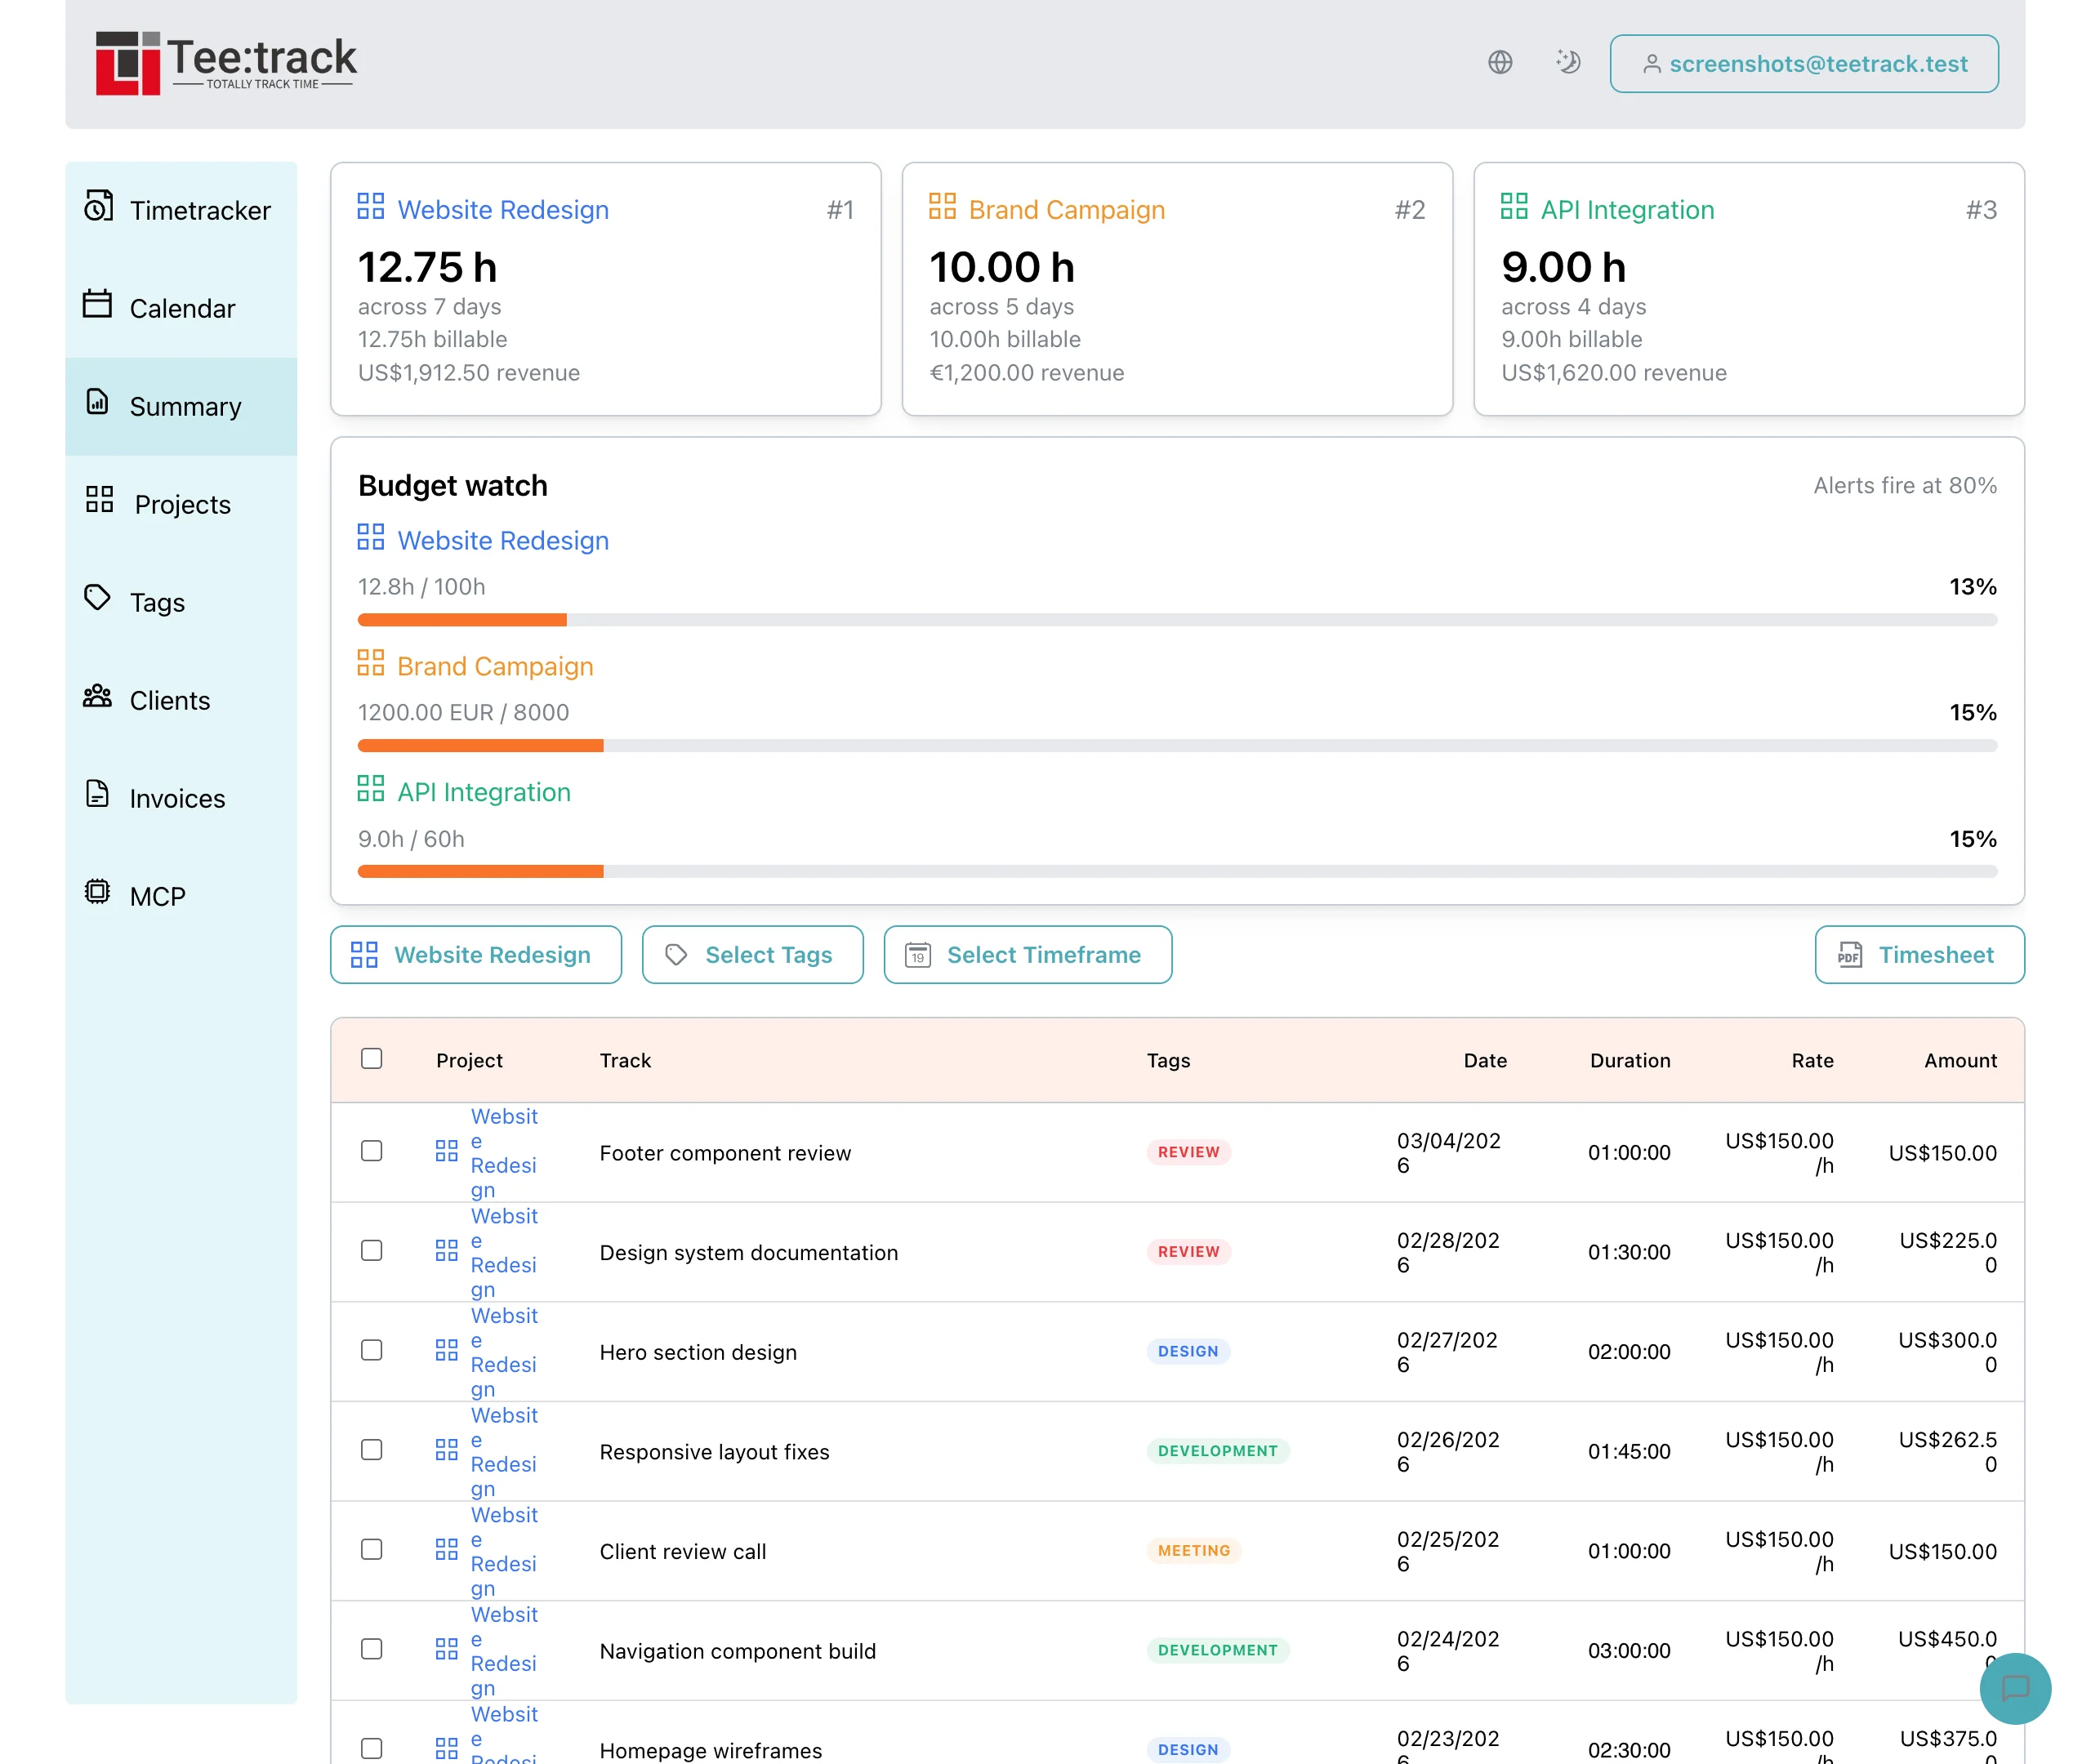
Summary shows cards for the three projects with the most tracked time in the selected period. Their hours and active-day counts help you choose where to begin a review, while the table below contains the individual work records.
Set the period before comparing projects
Choose the week, month, or custom range you want to review. The cards show up to three projects with their hours and active days in that period. Use the Project filter for a project outside those three; its absence from the cards does not mean it has no entries.
Suppose two projects each show ten hours. One may represent a single day of focused work and the other several short sessions spread over a week. The active-day count gives you a reason to inspect the entries; it does not, by itself, explain whether either pattern was useful.
Open the entries behind a total
Click the project name on a card to filter the table below it. The rest of the card is not clickable. The cards follow only the Timeframe filter and ignore any selected tags, so clear the Tag filter when you want the table to add up to a card’s total. Read the descriptions and durations behind the total, then click the same project name again to clear that project filter.
This gives the review a useful sequence. Start with a broad view, identify a project that deserves attention, then examine the sessions behind the number. A large total may be expected for a delivery week, or it may reveal additional work that needs a scope discussion.
Use the filtered view for reporting
Once the period and project are correct, check the entries before preparing a client report. For a project outside the top three, apply the same review through the Project filter. The Summary feature overview describes the available reports and export options.